NCInvestor
Sharing my ideas and thoughts on specific stock chart setups for Swing & Day Trading strategies based off of Technical Analysis.
Candlestick Patterns
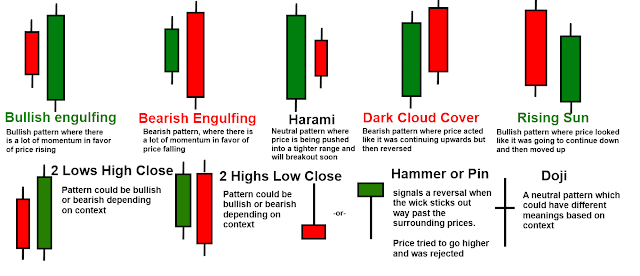
The ability to read candlestick patterns eats into the core of Technical Analysis. The ability to read candlesticks can become quite a lucrative venture if you stay disciplined. It can help determine both entries and exits of longer term positions, and set up good risk/rewards for trades as well. There are hundreds of various candlestick patterns, but there are 12 common ones I want to focus on in my study.
The Dark Cloud Cover
The Dark Cloud Cover consists of two candles. The first must be a large white candlestick (some refer to it as a Marubozu) closing towards the highs. The "wick" must not be very long on the top or bottom of this candle stick. The second candle must be a large black candle that opens above the first candle's close, and closes at or below the mid point of the previous candle. Your entry (short sale) would be below the low point of the second candle. Some traders will wait for the a close the next day below the low of the second candle to serve as confirmation; others are more aggressive and enter the name before the close. Stops will logically be places above the high of the first candle (I always like to put it a little bit above this - say $0.10 or so depending on the price of the security). This is a bearish reversal pattern and should only be used during an uptrend. It signals that the buyers are growing weary and the sellers are looking to regain control of the stock.
The Piercing Line Pattern
The Piercing Line is the exact inverse of the Dark Cloud Cover; therefore, it is a bullish reversal pattern when found during a downtrend. It also is a 2 candle pattern where the first bar must be a long black Marubozu closing near the lows. The second candle must open below the first candle's low, but finish at the mid point or higher of the first candle and form a long white Marubozu.
The Morning Star
The morning star candlestick pattern is my favorite bullish reversal to use in trading. It is a 3 candle pattern where on the first day you have a long black candle that closes near the lows (the wicks being relatively short). The next day the stock must gap down, but ultimately form a doji signaling indecision. This indecisive candle shows you that the selling may be finished; however, to confirm the next candle must gap up and form a long white bar closing near the highs. The wicks on the 3rd candle must also not be very long. Your confirmation of the morning star pattern is on the fourth candle. Entry will be above the high of the 3rd candlestick in the pattern.
The Evening Star
The evening star pattern is the inverse of the morning star explained above. It is also a 3 candlestick pattern, but signals a bearish reversal in an uptrend. The first candle will be a long white Marubozu that closes near the highs. The second candle will gap up, but finish with a doji candlestick which once again signals indecision. The third candlestick will gap down and form a long black Marubozu. Confirmation of the pattern will be on the fourth day with a close below the third. Your entry will be below the low of the third candlestick.
During the day I will tweet chart/position updates to my followers on both Twitter and Stocktwits (NCInvestor). Please follow me @NCInvestor.
Disclaimer : This is not an investment advisory, and should not be used to make investment decisions. Information in NC Investor Blog is often opinionated and should be considered for informational purposes only. No stock exchange anywhere has approved or disapproved of the information contained herein. There is no express or implied solicitation to buy or sell securities. The charts provided here are not meant for investment purposes and only serve as technical examples. Don't consider buying or selling any stock without conducting your own due diligence.
Thanks for visiting NC Investor Blog.
 Investor, Trader, Attorney, Sports Fanatic (Hokies, Tarheels & Panthers), Dog Lover, Loving Husband & Father.
Subscribe to:
Posts (Atom)


No comments:
Post a Comment